Case Study: The $5 Offer That Increased Pipeline Volume (and What the Data Really Said)
The Client’s Question
A growing service-based company introduced a $5 introductory offer as a low-friction entry point for new customers. It worked quickly: interest increased, deal volume climbed, and more prospects entered the pipeline.
But within a few quarters, leadership started noticing some worrying trends:
Conversion rates were dropping
Deals seemed to stall more often
Pipeline felt slower and less predictable
Sales reps were spending more time managing “open” deals
And the big question:
“Is the $5 offer hurting our sales performance?”
They asked us to analyze whether the $5 offer was the primary driver behind the observed decline in conversion efficiency and pipeline velocity.
The Hypothesis
The internal hypothesis was clear and logical:
The $5 offer is a primary driver of declining conversion efficiency and pipeline velocity.
More specifically, the concern was that the $5 offer:
Lowers perceived commitment at the point of entry
Reduces urgency to progress through onboarding and decision stages
Encourages evaluation behavior rather than purchase behavior
Increases the likelihood of deals stalling rather than closing
In other words: more leads, but worse sales performance.
The Approach: What We Analyzed in HubSpot
We performed a multi-period analysis using HubSpot CRM data. Instead of only looking at “before vs after,” we broke performance into half-year periods to see how patterns changed over time.
We analyzed:
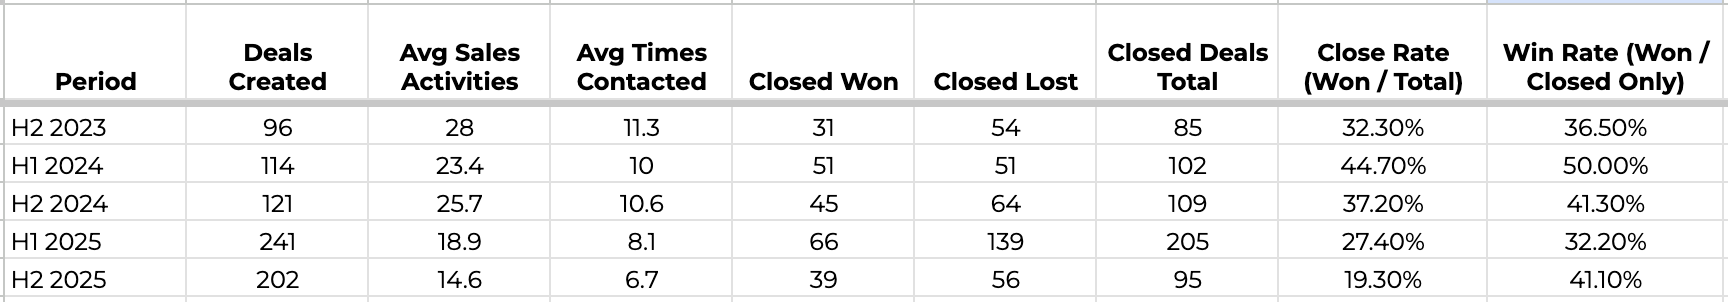
Sales Performance
Deals created
Closed won / closed lost
Close rate (won / total)
Win rate (won / closed deals only)
Pipeline Velocity
Average time to close (closed deals only)
Sales Activity & Coverage
Average sales activities per deal
Average “times contacted” per deal
Source Mix
Original traffic source trends (Direct, Organic, Paid Search, Offline, Unknown)
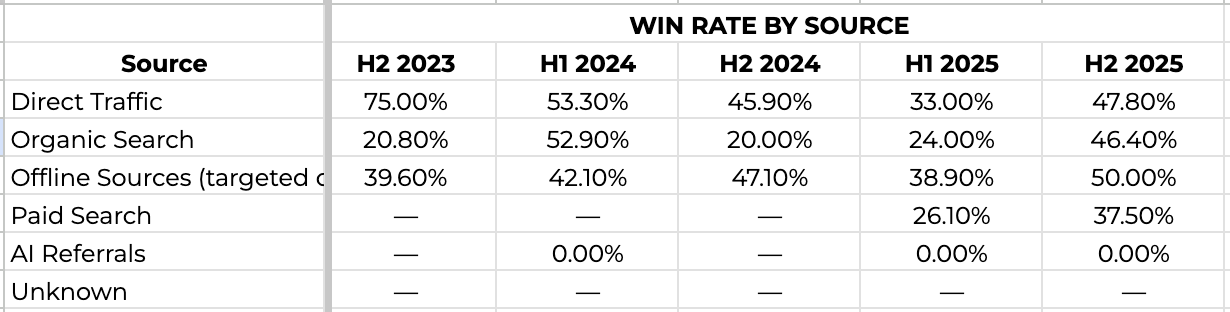
Win rates by source
Deal value by source
Important note on $5 offer attribution
We were able to identify the first $5 quote date, which established the earliest point where the offer was in use. However, we could not reliably flag every deal as “$5 offer used” vs “not used” because the offer wasn’t consistently tracked via a dedicated deal property.
That meant our analysis focused on trend-based impact, not strict $5 vs non-$5 segmentation.
What We Found (The Short Version)
1) Deal Volume Increased Dramatically
Pipeline volume expanded significantly over time. In the most recent year, deal creation volume was materially higher than prior periods.
This supported one part of the hypothesis:
✅ The offer (and related marketing motion) likely increased top-of-funnel activity.
2) Conversion Efficiency Declined — But Not Immediately After the Offer
Conversion efficiency declined later, not right away.
In fact, the period immediately following the offer rollout was not a collapse—it was one of the stronger windows.
This was a key moment in the analysis because it challenged the assumption that:
“The offer itself must be the main cause of declining conversion.”
Instead, it suggested something more nuanced:
⚠️ The offer may influence behavior, but performance depends heavily on how the pipeline is worked.
3) Sales Follow-Up Coverage Per Deal Dropped Sharply
One of the most consistent and telling trends was this:
Sales activity per deal decreased significantly over time.
When deal volume doubled, the average number of sales activities and contact attempts per deal dropped by nearly half.
That’s a classic capacity signal.
When the funnel expands faster than the team’s ability to work it, you typically see:
more deals entering “Not Now” or stalling stages
more open pipeline carryover
lower conversion efficiency
fewer closed outcomes per period
This supported a different root cause:
✅ Follow-up coverage per deal is a major driver of conversion performance.
4) Source Mix Shifted — Especially in Paid Search
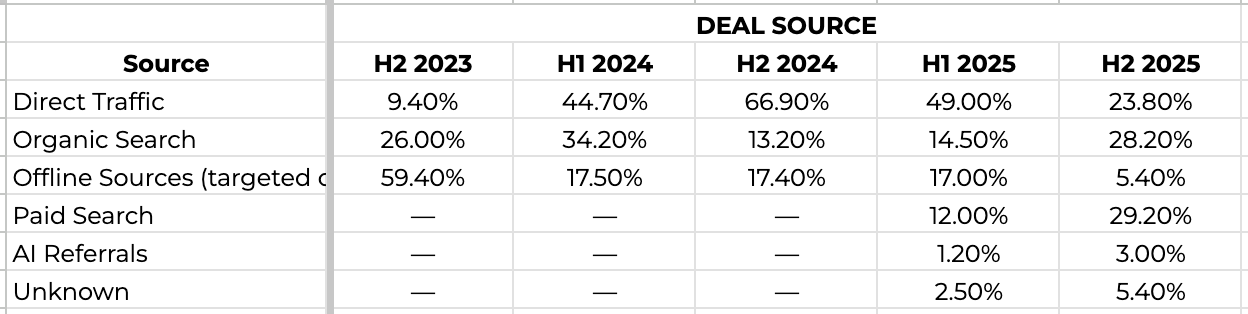
We also found that the lead acquisition mix changed significantly over time.
The biggest shift was the growth of Paid Search, which became a major source of created opportunities in later periods.
Paid Search typically introduces:
more evaluators
more comparison shopping
lower urgency at entry
higher need for follow-up to convert
At the same time, “Offline Sources” (which, in this case, represented targeted outbound segments) became a smaller portion of the total mix.
This matters because source mix impacts conversion math even when sales execution stays constant.
If you add more evaluation-stage buyers into the pipeline, you can expect:
higher volume
lower conversion rate
longer decision cycles
The Key Conclusion
The data did not support the conclusion that the $5 offer was the primary driver of declining sales performance.
Instead, we found something more actionable:
The $5 offer increases top-of-funnel activity and evaluation behavior, but conversion efficiency only declines when sales activity per deal drops.
The most likely drivers of the decline were:
Lead volume scaling faster than sales capacity
Reduced follow-up coverage per deal
Source mix shift toward Paid Search + Unknown attribution
More deals staying open longer and accumulating in the pipeline
This is a critical distinction because it changes the business decision from:
❌ “We should kill the offer.”
to
✅ “We should fix the conversion motion around the offer.”
What We Recommended (and Why It Works)
1) Treat the $5 offer as a “trial conversion,” not a purchase
Low-cost offers reduce friction—but they also reduce urgency. The solution is to build a conversion motion that drives momentum:
time-box the $5 trial period
create onboarding milestones
define the “upgrade moment”
trigger follow-ups automatically
2) Protect follow-up coverage per deal
When volume increases, sales execution must scale with it. We recommended:
minimum follow-up cadence by stage
automated task creation
SLA-style response expectations
pipeline hygiene rules for stale deals
3) Segment by source and tailor qualification
Not all sources behave the same. Paid Search leads may need:
faster qualification gates
clearer next steps
different messaging
a tighter timeline to decision
4) Improve tracking for future clarity
The team already had a CRM property designed to track $5-offer progression (Accepted, Signed, Missed Payment), but it wasn’t being used consistently.
We recommended standardizing this so future reporting can answer the real question:
Do $5-offer deals convert better, worse, or simply differently than non-$5 deals?
Final Takeaway
Low-friction offers can be powerful growth levers—but they change buyer behavior.
The real risk isn’t the offer itself. It’s what happens when:
the pipeline expands
lead intent shifts
and sales follow-up coverage per deal drops
When that happens, conversion efficiency declines and pipeline velocity slows—even if the offer is still doing its job at the top of the funnel.
Want to Run This Analysis in Your HubSpot Portal?
If your team is asking questions like:
“Why is pipeline growing but revenue isn’t?”
“Are we closing fewer deals or just moving slower?”
“Did our lead mix change?”
“Is our offer helping or hurting conversion?”
We can help you build a repeatable reporting model to answer those questions—using the data you already have.