HubSpot Lead Scoring 101: A Practical Guide to Fit, Engagement, and the Handoff
We've had three conversations with clients this week about lead scoring. A B2B marketing agency specializing in manufacturing companies. A physical printing company on the East coast. A B2B SaaS company that helps health and wellness businesses. They're all in completely different stages... from a startup finding its footing to a well-established company with 50 years under their belt.
And they're all asking the same question: how do we help our sales team reach out to the right people at the right time? One of them specifically wanted a way to verify that the leads they're bringing in actually match their ICP before anyone picks up the phone. Which is exactly what lead scoring does.
If you're managing HubSpot alongside about seventeen other things, it sounds complicated but is actually one of the best time-savers in the platform. Done right, it tells your sales team exactly who to call, when to call them, and why they're worth the time.
Here's how to build a model that actually works.
What is lead scoring, really?
Lead scoring assigns a numerical value to your contacts based on two things: who they are, and what they're doing. HubSpot splits these into two separate scores (fit and engagement), each with a maximum of 100 points. The combined score is the sum of both.
The goal isn't a perfect number. It's a clear signal: this one's worth your time.
Fit Score: Who are they?
Fit is about identity. It's the stuff that doesn't change much... job title, company size, industry, revenue. You're asking: does this person match the profile of someone we actually close?
Here's a basic model:
Job Title / Seniority:
C-Suite, Owner, Founder - 40 pts
VP, Director - 30 pts
Manager, Sr. Manager - 20 pts
Individual Contributor - 10 pts
Company Size (employees):
50–500 - 40 pts
501–1,000 - 20 pts
Under 50 or over 1,000 - 10 pts
Annual Revenue:
$10M–$50M - 40 pts
$5M–$9.9M - 20 pts
Under $5M or over $50M - 10 pts
Industry:
Target verticals - 30 pts
Adjacent verticals - 15 pts
Outside target market - 0 pts
A few others worth considering: geography (if you're regional), department (if your buyer could sit in sales, ops, or marketing), technology stack (if they're already using tools that integrate with HubSpot), number of locations, and years in business.
One practical note: you can only score on data you actually have. Before building out fit criteria, audit what's actually populating in your portal. If a field is mostly blank, it can't score.
Engagement Score: What are they doing?
Engagement is about behavior. It tells you how interested a lead actually is, based on what they're clicking, downloading, and visiting.
BOFU form (demo request, pricing) - 75 pts
MOFU form (case study, webinar) - 50 pts
TOFU form (blog download, newsletter) - 25 pts
Email click - 10 pts, 30 pts max
Email open - 5 pts, 15 pts max
Website page view (known contact) - 5 pts, 20–25 pts max
Notice that a BOFU form submission alone hits the 75-point SQL threshold. That's intentional. When someone fills out a demo request or visits your pricing page and converts, they're not a lead to nurture. They're asking you to call them. The score reflects that, and the handoff should be automatic.
MOFU hits your MQL threshold at 50. They're interested, but not ready. Keep them in nurture and watch the engagement score climb. TOFU gets them on the board. It's a signal, not a sale.
The caps on email and page activity matter too. Without them, someone who browses your blog 15 times can outscore someone who just requested a demo. Group limits in HubSpot let you set a maximum per activity type so one behavior doesn't inflate the whole score.
Page views only count if HubSpot knows who the contact is. Anonymous traffic doesn't score.
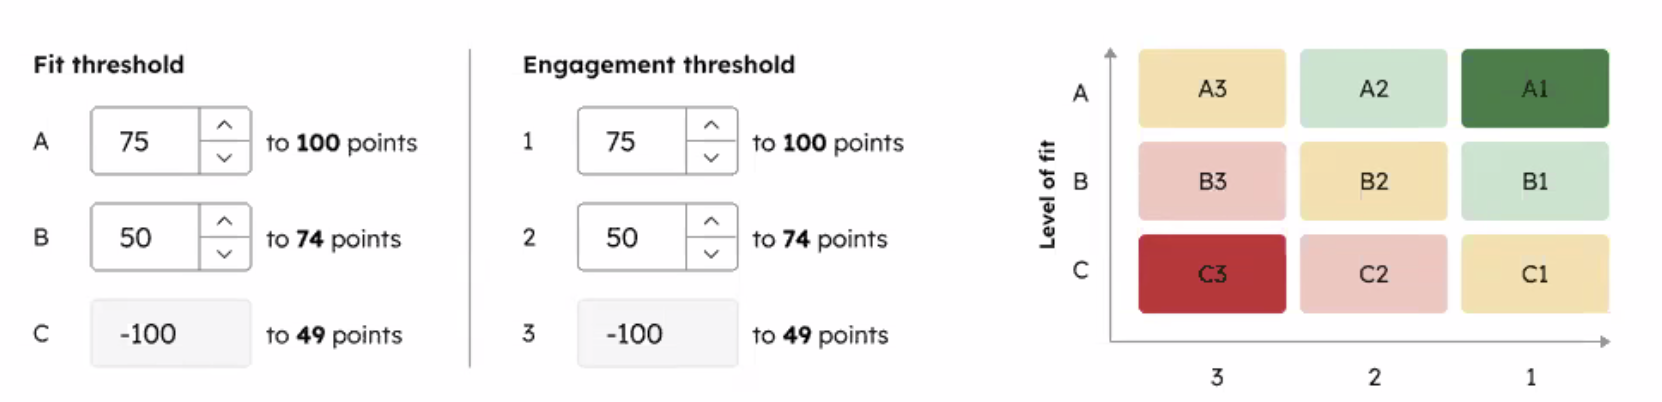
The 3×3 Matrix: How HubSpot Visualizes It
Once you set thresholds, HubSpot plots your contacts on a fit vs. engagement grid.
Fit is labeled A, B, C. A is high fit, C is low. Engagement is labeled 1, 2, 3. 1 is high engagement, 3 is low.
A1 = your best lead. High fit, high engagement. Sales should already be there. C3 = lowest priority. Low fit, low engagement. Not worth the time right now.
A common threshold setup:
A / 1 = 75–100 pts
B / 2 = 50–74 pts
C / 3 = 0–49 pts
This matrix is one of the most useful things in the lead scoring tool because it makes the nuance visual. A B1 (medium fit, high engagement) is a very different conversation than an A3 (great fit, not engaging yet). Both might have a similar combined score. The matrix shows you they're not the same lead.
Score Decay
Scores go stale. HubSpot's recommended approach is decay, not manual point subtraction. When a contact goes inactive, their score drops automatically over time. A common setup is a decrease after 30, 60, or 90 days of no activity. They don't disappear... they just sink in the queue until they engage again.
For contacts who were never a real opportunity (students, competitors, personal email addresses), don't score them at all. Create a disqualification list and exclude them from scoring entirely. Unsubscribes get unsubscribed. That's a list management issue, not a scoring one.
What This Looks Like in Practice
Lead A: Strong fit, low engagement. VP of Operations at a 200-person company. Fit: 80. Engagement: 10. Right person, just hasn't engaged yet. Light outreach is fine, but not a handoff.
Lead B: Weak fit, high engagement. Marketing coordinator at a 5,000-person company. Fit: 10. Engagement: 85. Clicking and downloading everything. But they're not your buyer. Nurture, don't prioritize.
Lead C: Strong fit, strong engagement. Director of Sales Ops at a 300-person company. Requested a demo, clicked 3 emails, opened 3 more. Fit: 80. Engagement: 85. This is your SQL. Get them to sales.
Lead D: Mid-tier fit, mid-tier engagement. Senior Manager at a 600-person company. Downloaded a MOFU asset, opened 2 emails. Fit: 60. Engagement: 35. Warm but not ready. Keep them in nurture and watch the score climb.
The Handoff: MQL to SQL
This is where scoring earns its keep. A good starting point:
50+ on both fit and engagement = MQL. 75+ on both = SQL, ready for sales.
Here's how to set it up in HubSpot:
Step 1: Set your thresholds. Configure your fit and engagement thresholds in HubSpot's scoring settings. This is where you define what A, B, C and 1, 2, 3 mean for your business.
Step 2: Build a workflow. Enrollment trigger: fit score ≥ 75 AND engagement score ≥ 75, then update lifecycle stage to SQL. Add a second branch for 50+ on both if you want a warm lead queue that isn't quite ready for a full handoff. For BOFU form submissions, you can also build a direct trigger (form submitted → instant SQL) so the handoff fires before the full scoring model even processes.
Step 3: Assign to sales. Inside the same workflow, add a task creation step or contact owner rotation. Sales gets notified automatically. No manual review.
Step 4: Create a sales view. Set up a saved contact view filtered by lifecycle stage = SQL, sorted by fit score descending. Sales walks in every morning and knows exactly who to call first.
Step 5: Review and adjust. Run your model for 60–90 days before changing anything. Are SQLs converting? If sales is getting flooded with weak leads, raise the threshold. If the queue is too thin, loosen it. Lead scoring is iterative. What worked last year may not work this year.
Start Simple
The biggest mistake with lead scoring is overbuilding it. Pick 3–4 fit criteria that actually predict whether someone will close. Start with your most important engagement signals. Turn it on. Watch what happens.
You're going to guess at first. That's fine. The goal is to move from guessing to informed, using your past conversion data to sharpen the model over time. HubSpot is already building toward more data-backed guidance inside the tool, including surfacing which pages correlate with actual conversions.
The model isn't set-and-forget. But once it's running, it does most of the work for you.
If you want help building a scoring model that fits your sales process, that's what we do.